Correcting Error/Warning Health Status in Digi Remote Manager 3.0
Within Digi Remote Manager, when a device’s Health Status is in an Error (red) or Warning (yellow) state, users can check what caused the condition(s) and then decide how to proceed accordingly.
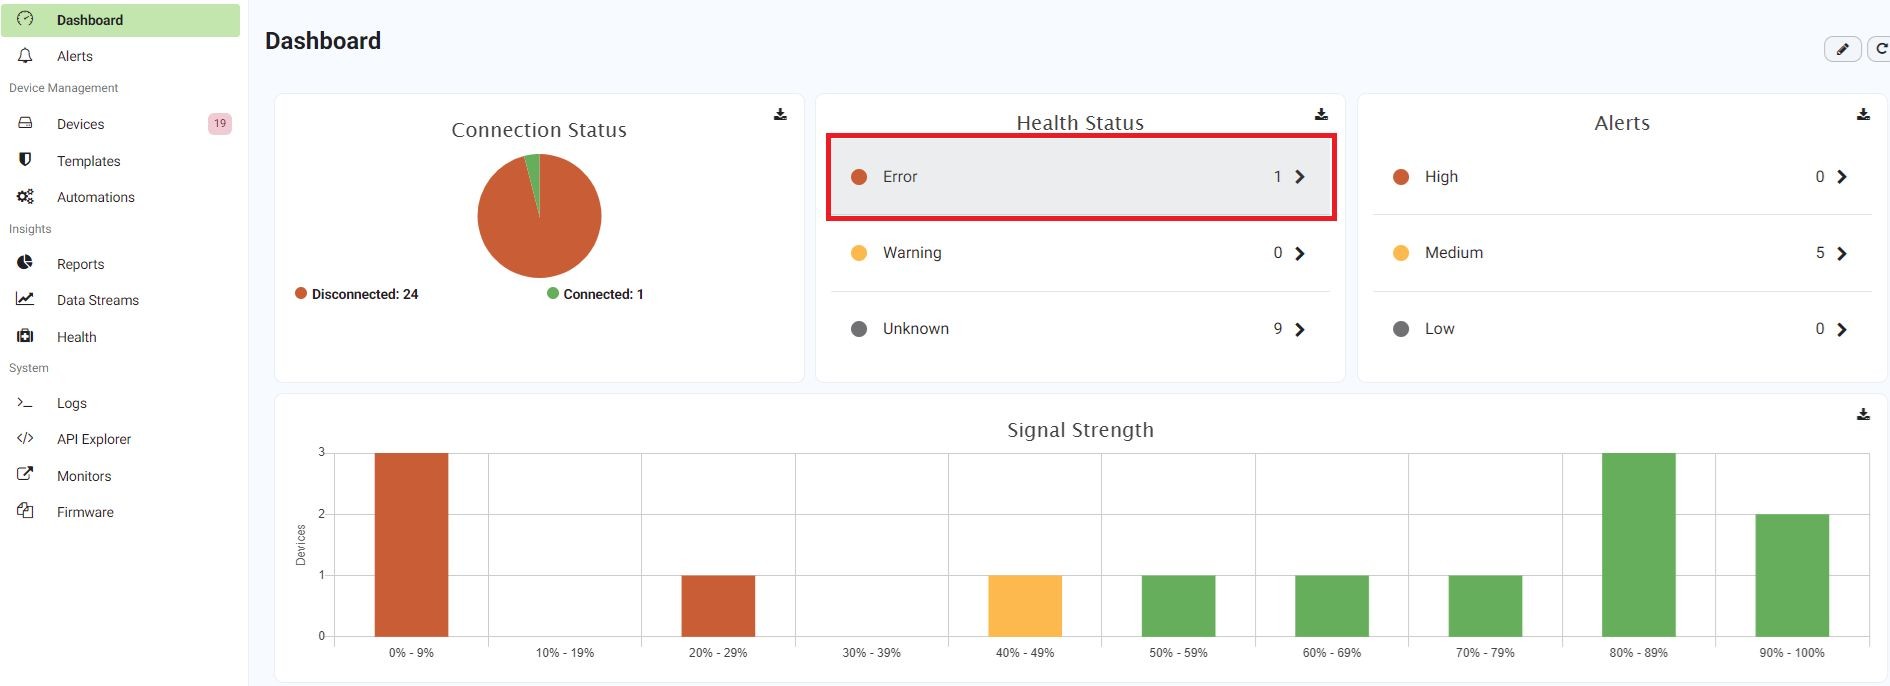
1) From the Digi Remote Manager Dashboard, in the Health Status tile, click “Error” or “Warning”. In this example, we will consider an “Error” Health Status.
2) All devices that have an Error Health Status will be displayed. Note the icon in the Health Status column which is highlighted in red just below.
.jpg?lang=en-US)
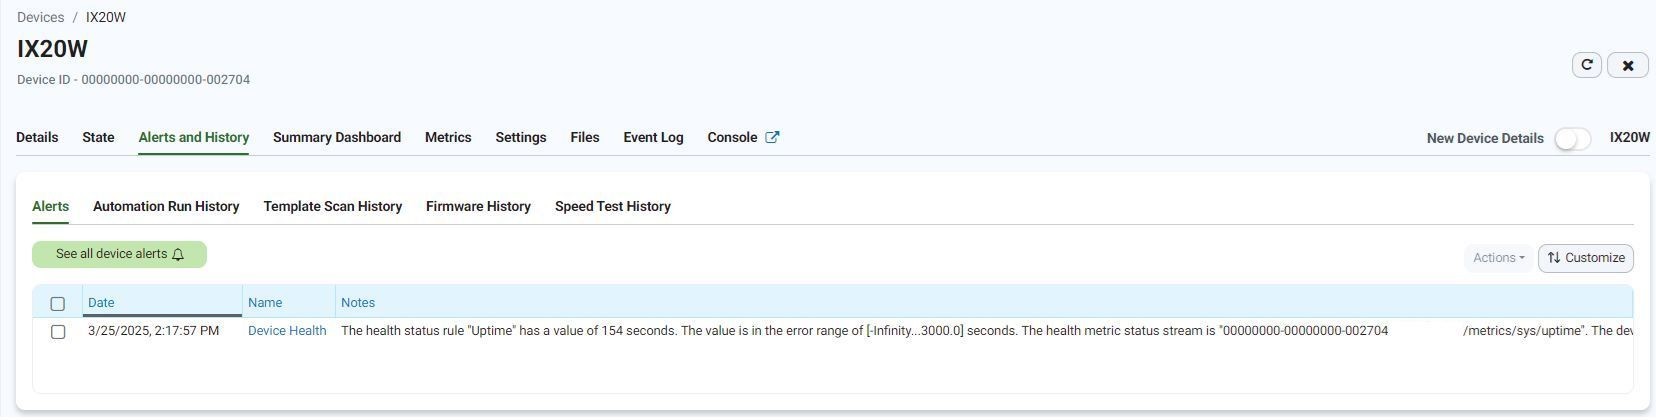
Clicking on a Health Status icon (e.g. a red triangle for an Error) will open the respective device’s Alerts and History tab, specifically the Alerts sub-tab, showing details about the metric(s) that caused the Health Alert(s). Selecting an alert then using the Actions button at the top-right allows its details to be shown.
4) At this point, the user may decide to:
a) Wait until the next metric report (1 hour by default, if the device is running the DAL OS). If/when the value is within the “Normal” (green) range, the Alert will be automatically reset.
-or-
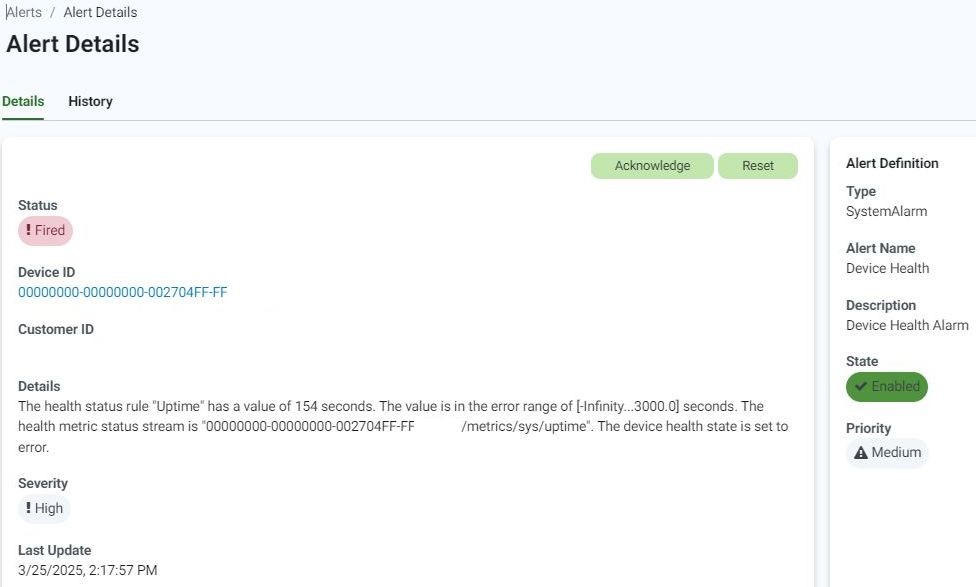
b) Acknowledge (via the green Acknowledge button) or Reset (via the green Reset button) the Alert. Acknowledge stops Digi Remote Manager from devoting resources to an Alert while still leaving it in a fired state. Reset clears the status of an Alert and returns it to the normal state.
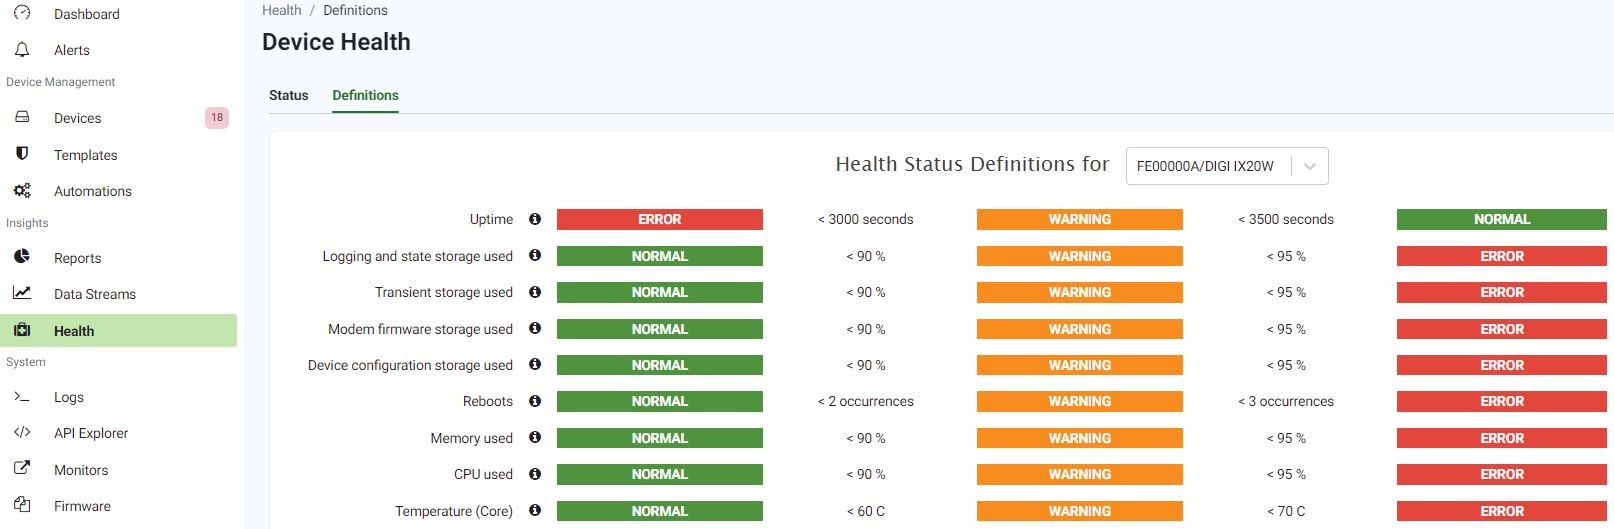
To view the Health Status definitions for a particular device type, navigate to Health > Definitions:
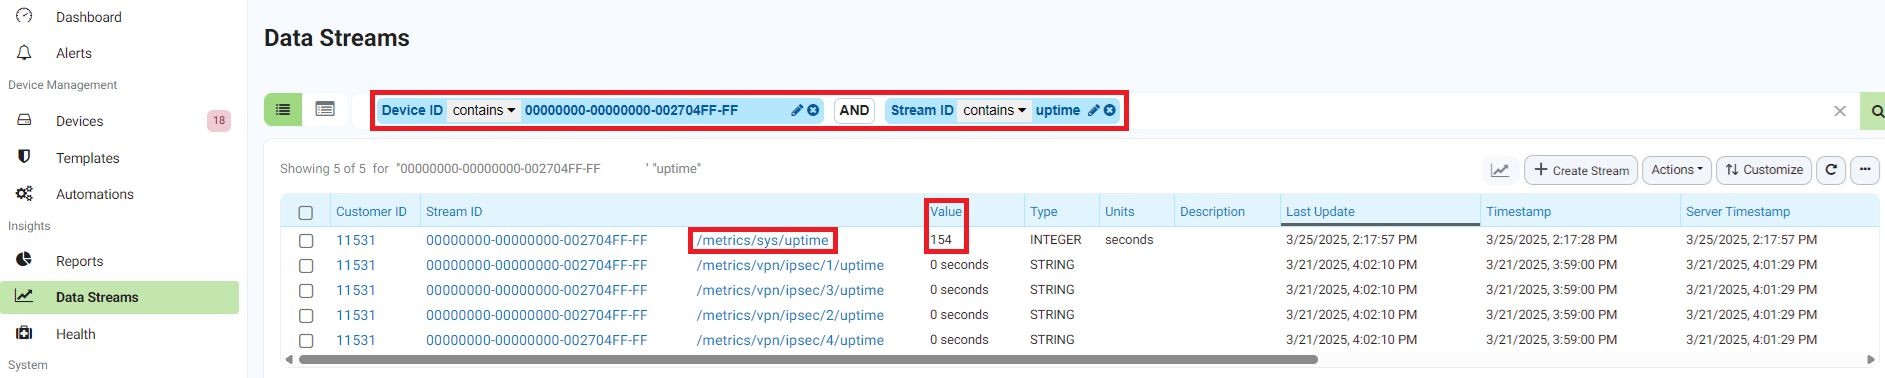
To view the history of values reported for a given Data Stream, navigate to Data Streams:
Last updated:
Sep 03, 2025