Cellular data overages can create financial disruption for your IoT network — especially when they’re unexpected. Even non-cellular Internet connections can show unexpected spikes that reduce a site’s available bandwidth and hinder its ability to provide expected and required services. Today, a data usage monitor can ensure network managers don't waste hours analyzing data consumption and tracking down the sources to uncover and resolve these costly overruns.
Digi intelliFlow™ — a key feature of Digi Remote Manager® — is a data usage monitor and network traffic visualization tool that provides actionable insights into your network’s application data, focusing on the top 10 users or top 10 destinations. This easy-to-understand representation of network activity enables you to update settings on your Digi devices or tailor your network to your site’s data needs. Digi intelliFlow gives you recent data and a historical reference to keep your networks running smoothly.
Combined with Digi Remote Manager, Digi intelliFlow provides a powerful tool to monitor data usage and combat excessive use and overage charges. While Digi Remote Manager tracks hundreds of data stream metrics from each device over time, it primarily focuses on the health and status of the Digi device. Digi intelliFlow goes further — drilling down on the traffic going through the Digi device. Digi intelliFlow provides deeper insights on the traffic, identifying the “top-talkers” so you can easily spot outliers or data-usage trends over time.
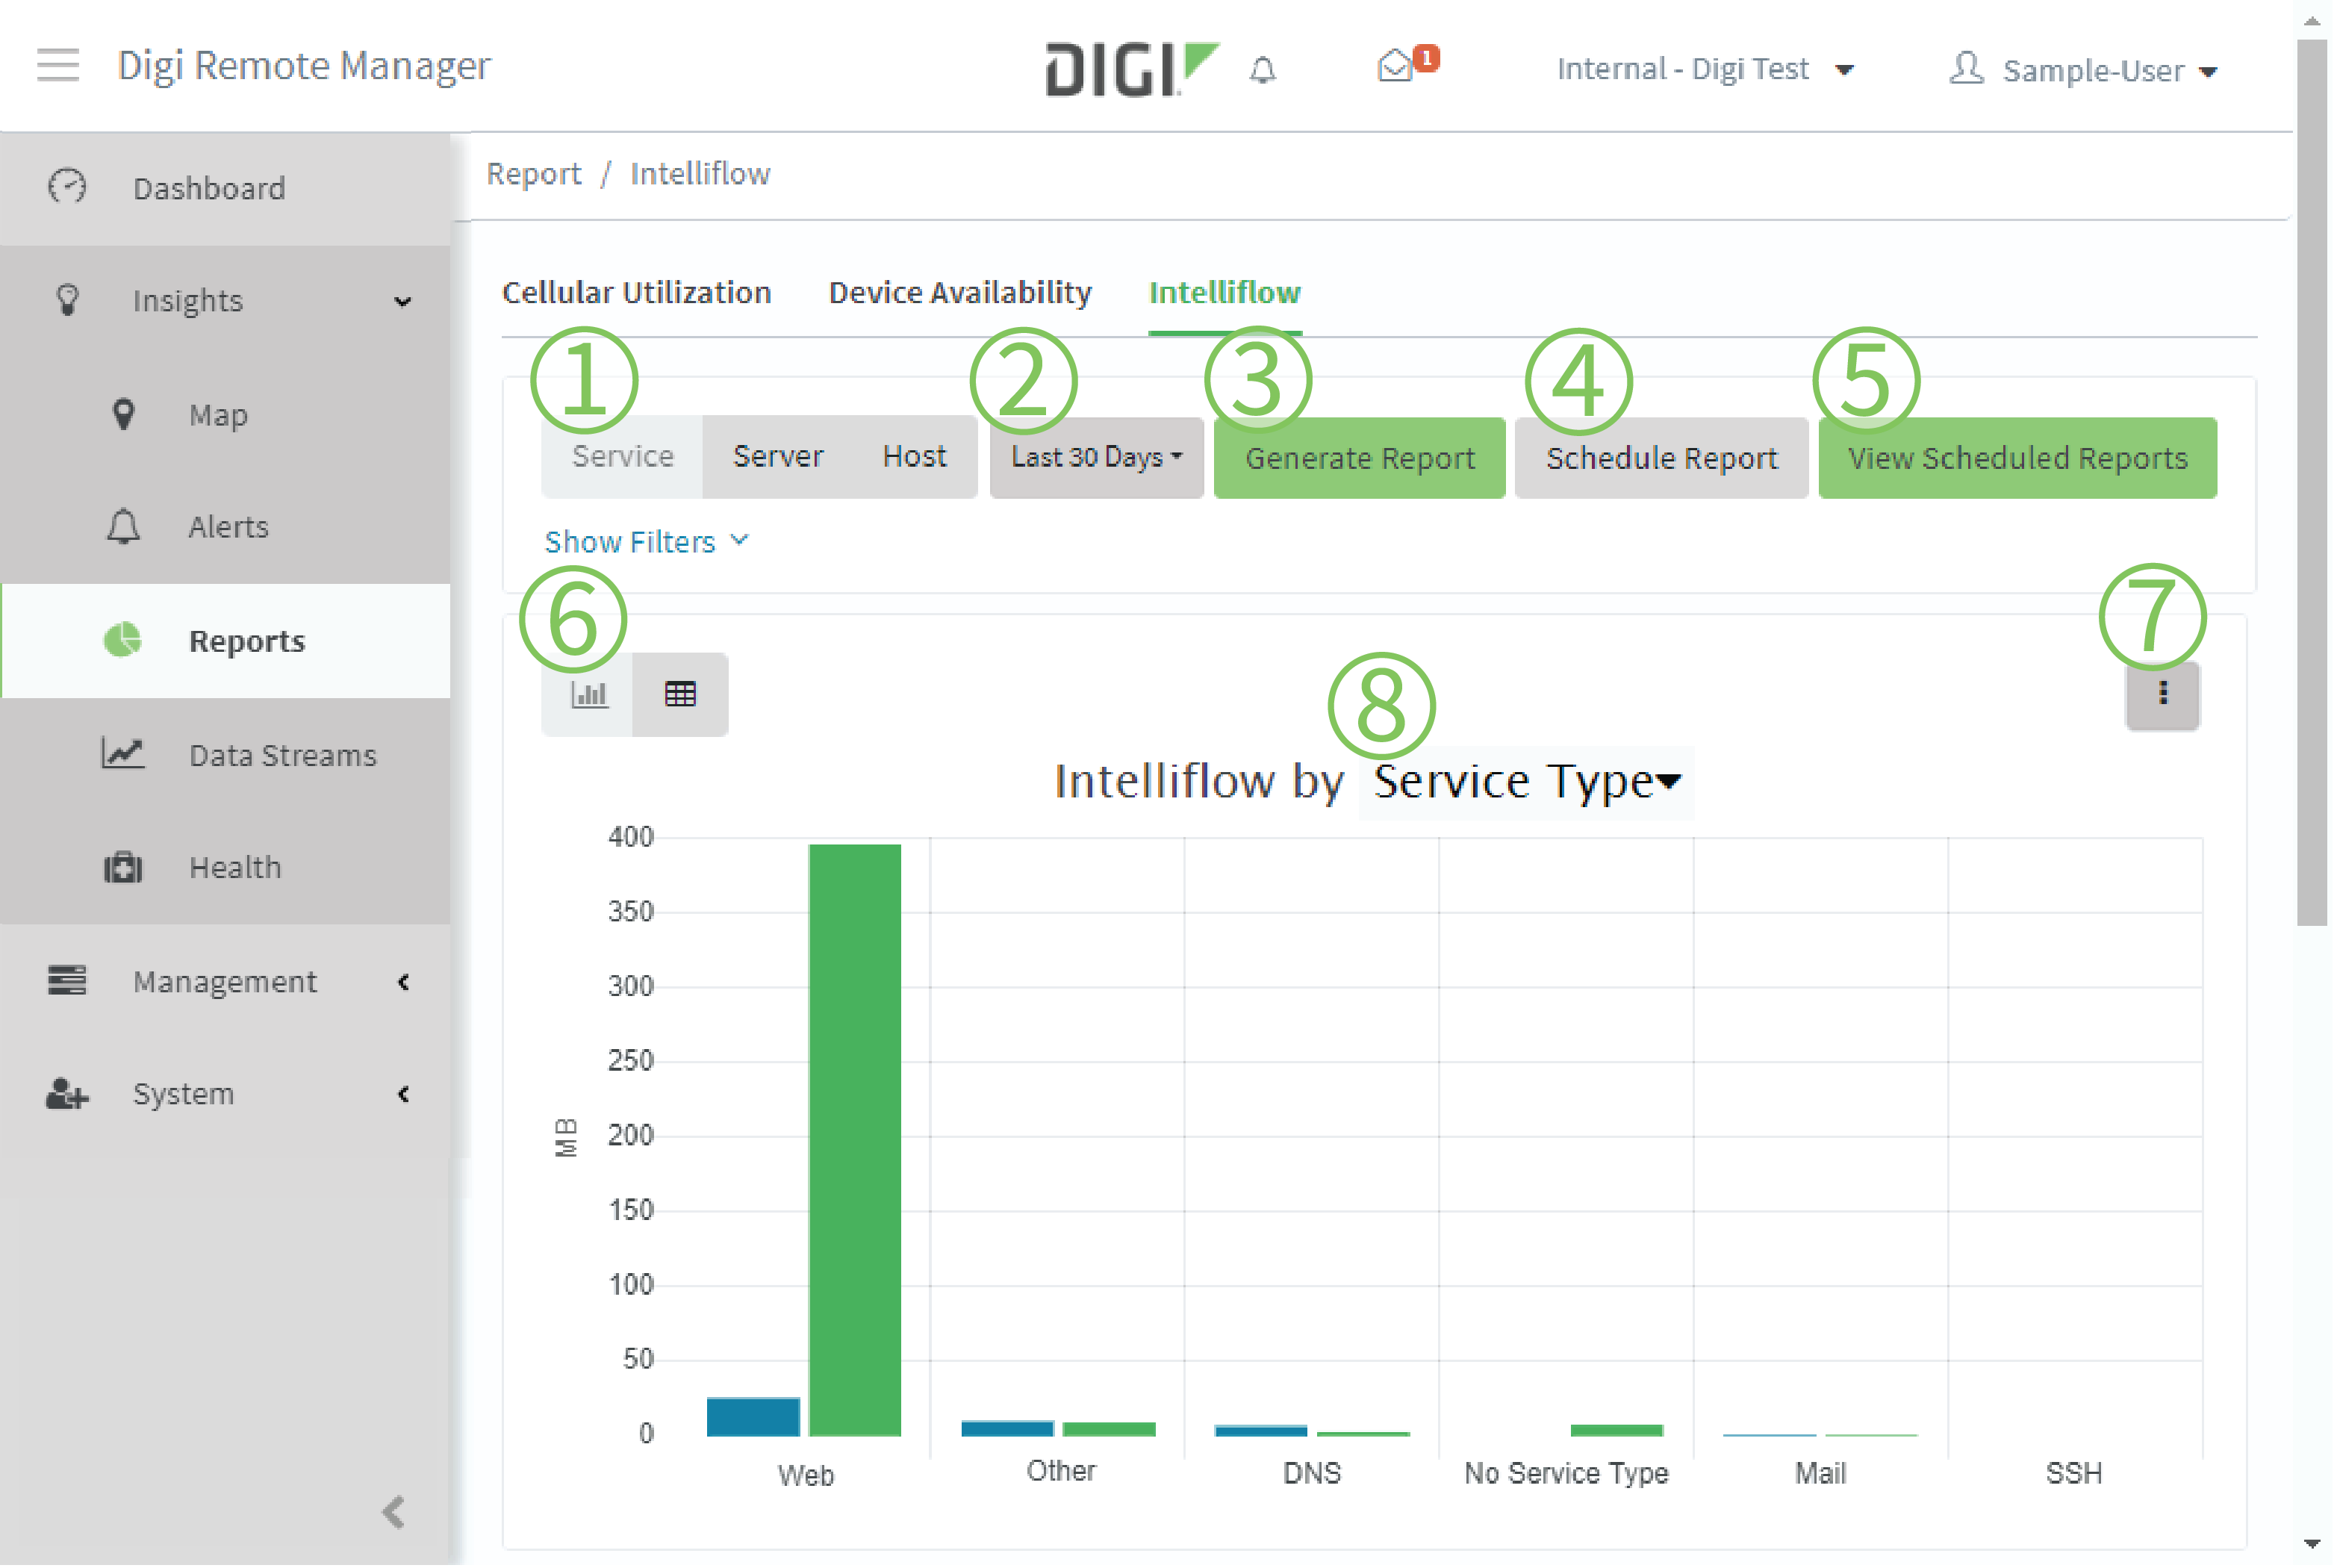
Here's a look at the Digi intelliFlow interface, followed by a description of the functionality.

| # |
Component |
Description |
| 1 |
Date and time selector |
Select a relative time, such as within the Last Hour, Last 30 Days, or Year to Date. Or enter a Start and End date. |
| 2 |
Filters |
- Click to expand Show Filters.
- Type or select values for the appropriate filters.
- Click Generate Report when finished
|
| 3 |
Report type |
Select the type of categorization for the report:
- Service: Displays Digi intelliFlow data by Service type or Port.
- Server: Displays Digi intelliFlow data by the destination server being contacted.
- Host: Displays Digi intelliFlow data by the internal host that the traffic originated from.
|
| 4 |
Schedule report |
Click Schedule Report to open the Scheduled Report Options dialog. |
| 5 |
Views |
- Click the bar graph icon to view the data in chart format.
- Click the table icon to view the data in tabular format
|
| 6 |
Display options (chart view only) |
Click to:
- Set the unit of data to be displayed. Available values are KB, MB, GB, or TB.
- Set the number of top sources to be displayed. Available values are 5, 10, 20, or all.
- Set the sorting order. Available values are Total, Bytes Sent, Bytes Received, or Server Address.
- Download a copy of the chart in PNG, JPEG, or SVG format.
- Export the chart in comma separated value (CSV) format.
|
| 7 |
x-axis (chart view only) |
- Service view: Change between Service Type and Port number. See Service type for further details.
- Server view: Change between Server Domain and Server Address.
- Host view: Change between Host Domain and Host Address.
|
The combination of Digi Remote Manager and Digi intelliFlow lets system administrators, technical support professionals, and network administrators view devices connected to the network and monitor data usage, review trends and spikes, and set custom alarms that send notifications when a device approaches or exceeds monthly data limits. Digi Remote Manager can also aggregate individual site or device data to present usage analytics for groups of devices for further insights into network usage.
See Network Traffic — And Prevent Overages

With Digi intelliFlow, you can easily identify your top 10 sources of data consumption at each site — or over your entire fleet of sites. You also see what type of data those top talkers are generating and where that traffic goes. This gives network admins the insights they need to combat excessive data usage on the network and continue to monitor for additional spikes or trends over time. Digi intelliFlow is included with each Digi Remote Manager premier license at no additional cost, and it’s available on all Digi routers running the DAL operating system.
The Digi intelliFlow data usage monitor is ideal for retail stores, public Wi-Fi networks, transportation networks, and remote industrial sites that can be susceptible to rogue devices being connected to their network. You can also use Digi intelliFlow on corporate equipment to prevent abuse or unintended/unacceptable network usage. Digi intelliFlow provides the ability to identify those rogue devices along with what systems they’re communicating with. You can quickly spot unexpected device activity on the network, mitigate it, and continue to monitor for additional trends over time.
Looking for an app or data usage monitor that can support effective network insights? Check out Digi intelliFlow — a free tool for monitoring data usage available with Digi Remote Manager and DAL OS based devices.
Next Steps